
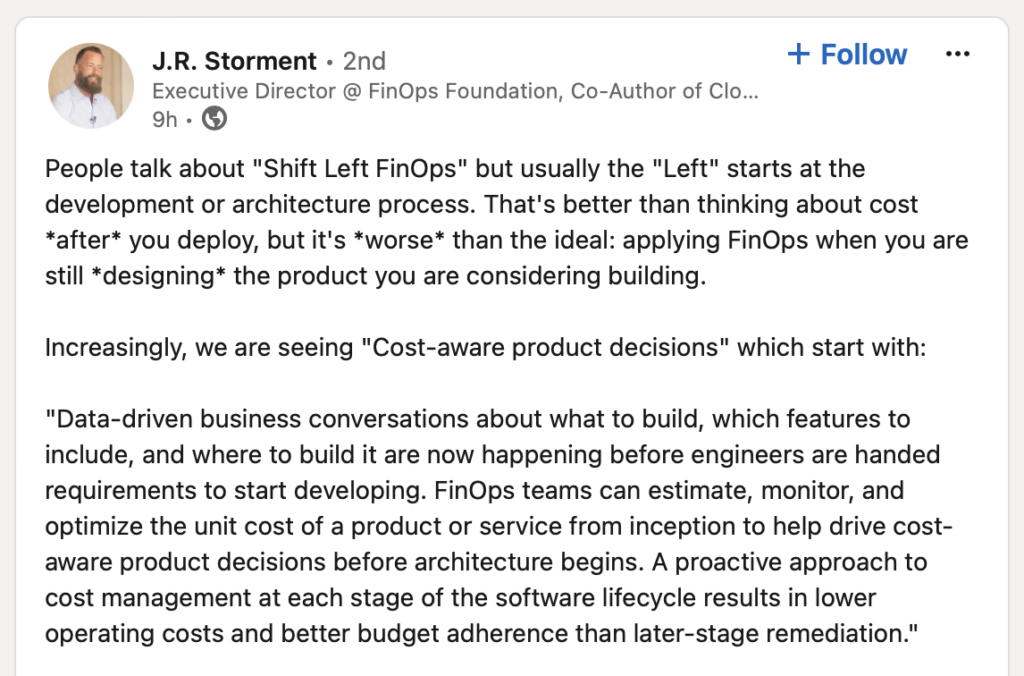
There’s been a lot of talk about “Shift Left FinOps” lately, but most of the time, “left” just means starting at the development or architecture phase. That’s definitely better than waiting to think about cost until after you’ve deployed, but as J.R. Storment, Executive Director at FinOps Foundation, pointed out in a recent LinkedIn post, it’s still not ideal. The real win happens when you bring FinOps into the conversation before development even begins, right when you’re still designing the product.
JR also linked to a FinOps article that dives deeper into this shift. You can check it out here: Cost-Aware Product Decisions on FinOps.org
This article is a good start to an important topic. Suddenly having cost as a non-functional requirement during the concept phase of one of my first large-scale cloud projects over 15 years ago ultimately led me to found CloudZero, and it’s a game changer for cost optimization.
The LinkedIn post gets it right by describing unit cost metrics as the right way to rationalize costs for engineering, but there are a few important points missing, and one big one: the chart fundamentally misrepresents how unit costs evolve over time.
CREDIT: FINOPS.ORG
The Problem With the Traditional Cost Curve
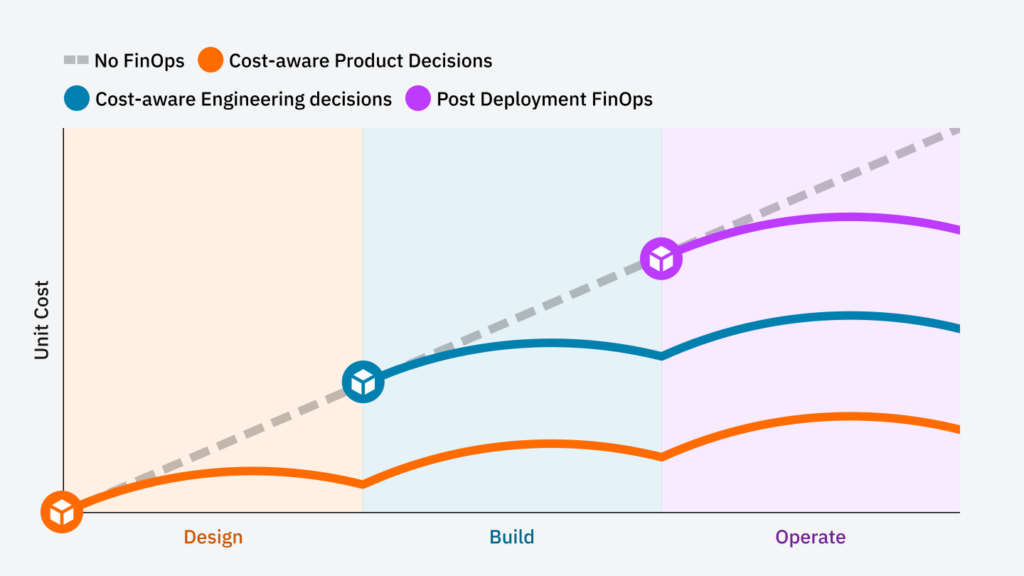
Most cost-aware product decision charts follow an incorrect arc pattern, assuming costs rise, peak, and then decline symmetrically. But in reality, unit costs should start out high and decrease as the system scales—if it’s well-architected.
Here’s how the unit cost curves actually behave in different scenarios:
- A well-architected system (orange line) starts with a high initial cost during design, decreases as growth takes off, and eventually flattens—or even declines over time—due to improved efficiency.
- A suboptimal system (blue line) follows a similar downward trajectory but at a slower rate, flattening at a higher cost point.
- The worst-case scenario (purple line)—often associated with lift-and-shift migrations—starts expensive, drops after aggressive cost-cutting, but then continues rising indefinitely. That’s the fate for most lift and shift, unfortunately.
This means that organizations relying on lift-and-shift cloud migrations are setting themselves up for an unsustainable cost trajectory. Unlike cloud-native architectures, which improve efficiency over time, lift-and-shift environments lack the fundamental elasticity needed to lower unit costs as they scale.
How to Structure Costs Across Phases
- First, establish a budget for each phase. During design, build, and operate, define what you want the budget to be. To do this, start by defining what your key unit cost will be at the operate phase that correlates with the demand driver. As a rule of thumb, this is the steady state you need to hit to achieve 80% margins.
- Then, work with the business to understand growth expectations in the first year of operation, broken out by quarter, with the expectation that the budget will change every quarter. Set the expectation that as the growth projections change, so shall the budget. Unit cost x usage estimate = budget.
- Next, adjust the unit cost to the number to achieve break-even and do the budget calculation again, with expected growth (or usage) during development. This means that as the product moves from beta to general availability, the unit cost should follow a predictable downward trajectory, rather than following an arbitrary arc.
- Finally, adjust the unit cost number again, but multiply the break-even number by 25. Multiply by expected usage during design (which should be low), and this is your budget for design.
This should give you a cost efficiency curve that reflects real-world cloud dynamics: High initial costs during design, a steep drop during development as early inefficiencies are ironed out, and then a stabilization (or further efficiency-driven declines) in the operate phase.

I call this the “Cloud Efficiency Engineering Curve,” and it can become a flywheel for profitability. This is also powerful for setting expectations with the business upfront and helps them understand how costs will evolve during the project. It sets all teams up to win later when the costs are rising but, because of strong unit metrics, every dollar spent clearly translates into profit.
There is something even more powerful that happens during design and development, however, when you set budget and unit cost constraints on an engineering project: innovation and faster time to market.
Constraints breed innovation, and anyone familiar with the theory of constraints in manufacturing understands how powerful they can be. By committing to a set of unit cost metrics and budget goals and making them visible to the engineering team, you set in motion a forcing function that will drive better system design, which in turn drives better architectures and forces a more modern system design. This is exactly the kick teams need to explore newer, more cloud-native technologies versus conventional or legacy approaches, which can be wildly inefficient (think lift and shift), but are often chosen because “it’s familiar and it’s how we have always done things.”
The outcome from this should be clear: a better upfront understanding of how cloud costs will ebb and flow with growth, and how efficiently they need to operate at each phase.
NB: As I write this I am in Hawaii and it’s hard for me not to think about waves right now. The Cloud Efficiency Curve is a wave that is predictable and prevalent in any cloud-operated business.